Totalt antall sidevisninger

fredag 29. juni 2012

Ancient Gotlanders in Finestructure

EDIT 30/08-2013: I now consider this analysis outdated. Please check the more recent posts with reanalysis of Ajv52, Ajv70, Ire8, Gok4 and Ste7.

We continue the analysis of the ancient Gotlanders vs our project participants.

In the last analysis using ADMIXTURE we assumed that all SNP's where independent from each other. However in reality we are working with segments of linked SNP's or haplotypes. Chromopainter can analyse haplotype and Finestructure can build a tree based on these.

Input: 22k SNP's. MCMC: 100 000, 100 000, Tree: 10 000, 100 000. HapMap recombination map. c-factor: 0.0262 (effective number of independent genetic element).

THE RESULTS:

FIRST ANALYSIS:

ChunkCounts:

The number of shared segments tree appears to set the ancient Gotlanders at its own branch already at the root of the tree. The closest neighbour is the common Finnish and Saami branch. The branching seem to indicate that Finns and Saamis are closer to the ancient Gotlanders than other populations.

The Finnish cluster is closer maybe indicate a closer relationship than the Saami. It would then be in accordance with the earlier ADMIXTURE analysis:

Note that the the various degree of sharing to the ancient Gotlanders at the rightmost vertical partly yellow strip. Yellow indicate more distant relationship gradiant towards blue is closer relationship (see vertical bar to the right of the matrix).

The ancient Gotlanders appears to have various degree of sharing to other individuals. The reason why the tree is so fragmentet is because of the very low c-factor. It indicate that the elemets are very fragmentet because of few markers (22k). A c-factor of 0 is basically independent SNP's while a c-factor of 1 is basically linked SNP's. In our last Finestructure analysis this factor using 289k was a round 0.48


ChunkLength.

The total lenght of shared segments indicate much the same structure as mentioned above but with some internal movement.


EXPERIMENTING:

I did however during my own experiments with Finestructure play around with the c-factor parameter. If I set it to 1 meaning considering the result as one independent genetic element the results changed.

ChunkCounts:


We see now that the Saamis and Finns changed place, the Saamis closest to the ancient Gotlanders while a subsection of the Saami and Saami related individuals moved to the top. We now also see the more familier typical Finestructure matrix clustering.

We can now also see from the coloring vs the ancient Gotlanders that its only the two Saami groups that have increased sharing with the ancient Gotlanders at the rightmost vertical that move into pink meaning the closest.

ChunkLenght:

The total segments shared give a similar story but all the Saamis are now into the same cluster. The coloring seem to indicate that Saamis have the closest relationship, then Scandinavians, then Lithuanians and then finally Finns. This is not in accordance with the earlier ADMIXTURE analysis.


DISCUSSION:

The first analysis appears to be in accordance with ADMIXTURE and is after the book prescribed by the authors of Finestructure. Finns are the closest to the ancient Gotlanders when assuming many genetic elements,

However if assuming only one genetic element the result is in accordance with Chromopainter raw output data for ChunkCounts and ChunkLenght that says that on population average Saamis are the closest to the ancient Gotlanders, then Scandinavians, then Lithuanians and finally Finns.

In my earlier analysis below using only Chromopainter without the help of Finestructure the population assigment for individuals have been correct for most individuals and this analysis appears to show correct and known relationships between the populations in question when assuming c-factor of 1. If assuming a c-factor of 0 the analysis would probably converge more with the ADMIXTURE analysis.

It seems therefor to me that the clustering of Finns close to the Saami maybe be due to more recent connections like migration of Finns to Saami. This because the connection to the ancient Gotlander appears more distant for Finns than for Saami.

The connection of the ancient Gotlander to the Scandinavians seems to be direct. It doesnt seem to have gone through the North-Saamis or Finns as they look like today to Scandinavians. However we know little about the genetics of the South-Saamis. The individuals of partly South-Saami ancestry that show up in the MDS-plots have not maanged to differentiate themself enough in this analysis from Scandinavians.

(Updated 01/07/2012)

søndag 24. juni 2012

Ancient gotlanders vs worldwide variation

EDIT 30/08-2013: I now consider this analysis outdated. Please check the more recent posts with reanalysis of Ajv52, Ajv70, Ire8, Gok4 and Ste7.

I got some second opinions after my last analysis so this time I have compared it to most of my worldwide dataset. The new analysis gave much the same result as the previous one for the ancient gotlanders "Comp22k", however for some of the runner ups the result changed somewhat.

Analysis technical details: ADMIXTURE run K=8, n=2254 individuals, 22k SNPs. All individuals where phased and divided into two individuals before ADMIXTURE analysis. After ADMIXTURE analysis each individual was merged into one individual. This because the ancient data from Gotlanders are "haploid" while all individual and population data is diploid.


THE RESULTS

The table below have been sorted in decreasing order by percentage belonging to cluster "European". The clusters have been named after what geographic area it has shown the highest frequency. Identified clusters are American, Oceania, East-Asia, Siberia, Medeterian, Europe, Central-Asia and Africa.


The graph below have been sorted in decreasing order by percentage belonging to cluster "European" as above.

As we can see the Saamis went down from number second in the first analysis to number ten in the this analysis. The main reason for this is that Saamis have a major Siberian component it shares with the Chuvash. The Chuvash on the other hand moved from number four to number twenty. The previous analysis appears to have moved the "European" component far north-east.

Finns that is our project Finns appears to have kept high on the list and only moved from number three to number four. The 1000 Genome Finns that was not part of the previous analysis however moved into second place.

The Estonians went up on the list from no five in the previous analysis up to number third. The Lithuanians went up from number seven to number five.

Norwegian and Swedes went up from number nine and ten to number six and seven.

DISCUSSION

As we can see the ancient Gotlanders had the highest "European" among all the todays populations.

What imidiatly catch the eye is the higher "Africa" component. Its not similar to any of the contemporary populations, not before we reach Spain we see anything close to this frequency. I suppose several hypothesis: 1) its a glitch by ADMIXTURE 2) its remnant from contact with Africans in the Iberian ice refugee 3) some other unknown reason.

We see that the Central-Asian component for the ancient Gotlanders is the smallest in the dataset of neighbouring populations. The closest neighbours is the 1000G Finns and Saami. This may suggest that Central-Asian influence did to less extent reach the ancient Gotlanders, Finns and Saami than other Fennoscandian populations.

We see that the Medeterian component to the ancient Gotlanders is low and in the same neigbourhood as for Finns, Saamis and Estonians. This ïndicate that the Medeterian influence to less degree reached the ancient Gotlanders, Finns, Saamis and Estonians.

The Siberian and other more distant components the ancient Gotlanders appears to have been less influenced by this components than Saamis and Finns, similar to Estonians, but higher than for Norwegians, Swedes and Lithuanians. This could indicate a later Siberian influence that didnt reach the ancient Gotlanders. Note the unfamiliar composition of elements. The ancient Gotlander have the highest frequenncy of the American and Oceanic compoinent in the dataset and zero clustering to the East-Asian component.

LOOKING BACK AT EARLIER ANALYSIS:

In earlier analysis I have shown that Lithuanians, Estonians and Lithuanians in particular appears to have some of the lowest mutation densities to the continental-european populations. As far as I can tell at this stage this is not in compatible with having at the same time the most similar components to the ancient Gotlanders. The Saamis on the other hand appeared to show higher mutation counts to most of other populations. More analysis with other software like Chromopainter may shed some more light on this question.

Note if we remove the Siberian, American, Oceanic and East-Asian component from the Saamis, the Saami would appears as number four among the populations with the highest European component with the ancient Gotlanders as number three and with both Fnns as number one and two, with Estonians and Lithuanians as runner ups.

INDIVIDUAL RESULTS

Individual estimated admixtures:

Top 10 individuals with the smallest estimated component difference:


(Updated 26/06/12)

onsdag 6. juni 2012

MDS plot update 75 participants

We have received some more participants. As usual the MDS plot then will be updated. This time I have added the Chuvash, Mordovians and Ukrainians to the reference population set as it appears to provoke the Saamis and Finns to seperate from each other. In this plot I have reduced the number of individuals from each reference population to 8 for practical reasons as it allows use of the Excel based 3D plotting program that have limited capacity. Also unbalanced number of samples may scew the result.

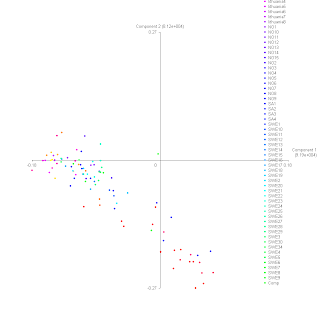
We see in the first dimension a familiar structure to what we have seen before but mirrored in the opposite direction. To the far left on the X-axis we see the Italians. On the far right we see the Chuvash and two Saami individuals. From the Italians toward the Chuvash and the Saami we see a split into two branches where continental European populations is in the upper branch while the Brits, Scandinavians, Finns and the Saami dominate at the lower branch.

The MDS program picks a subset of the total used SNP that show the largest indepented variance in the dataset. Dimension 1 or the x-axis here clearly show that its the east and west dimension that have the largest variance or difference where Italians appears the most west while the Chuvash and the Saami have the most east. The other populations appears as gradients between these extremes.

Dimension 2 or the y-axis appears to show more a north-south dimension. It seperate Fennoscandians from the continental populations with the exception of the British who appears to follow the Scandinavians the first step at the root of the Fennoscandian branch. We here see the Estonians in the gap between Finns and the Ukrainian, Lithuanian, Vologda Russiand and Mordovian cluster.


We then move to the 3 dimension or the y-axis on the plot. In the plot below its combined with the dimension 1 or the x-axis. We see here a shape that we also have seen in earlier analysis but the interpreation may be more difficult. We see at the top a cluster with especially Lithuanians and Belorussians at the uppermost part, then follows Finns, Mordovians, Vologda Russians, Scandinavians, continental Europeans and the Saami. The Chuvash at the bottom.


As we can see here it appears Saamis have frequencies of SNP's in this third dimension that resemble French, Romanians and Italians the most but as we can see from the dimension 1-2 that Saamis in the first dimension appears to have a frequency of SNP in that dimension that in part most resemble the Chuvash. So it may be the Chuvash that pull the Saamis so far south as before mentioned western Europeans (you may also get this impression by look it in 3D). Also note that it appears that especially Italians have a frequency of SNP similar to the Chuvash in this dimension. What make Chuvash and Italians connect here I do not know at the moment. However if we compare the earlier Chromopainter runs there is no direct and recent connection between the Saami and the Italians or French as seen through mutation density and segmentsize.