I want to return to the differences one sees between donors and receivers. The sharp observer would probably notice the difference between the donation and receivers between f.ex Finns and the Chuvash or even in general between Saamis and Finns and other populations. The Finns dont use much Chuvash chromosomes to paint there chromosomes but Chuvash use on the other hand more Finn chromosomes to paint their chromosomes.
In the "newick" format it could be written as C(F1,F2). It has nothing to do about ancestral to who but is a tree representing three current populations. Where C vs F1,F2 coalesce at a time t1 and F1,F2 coalesce at a time t2. As we know it is correct to assume that F1,F2 coalesce at an later time than vs the C and probably F1,F2 similar coalesce time to C.
If we then assume that F1,F2 have have very distinctive haplotypes the painting of F1,F2 will ignore copying chunkcounts from C as it can find closer haplotypes internally, but C on the other hand is equally distant to F1,F2 will copy smaller chunkcounts from both of these. This will result in a symmetrical chunkcount heatmap.
ID C F1 F2
C 0 0.5 0.5
F1 0 0 1
F2 0 1 0
This can be seen very clearly as an extreme case with the ancient gotlanders vs modern populations, where the modern populations copy very little chunks from the ancient gotlander but the ancient gotlander copy much chunks from the modern populations as there a no other to copy from. If we had than one ancient gotlanders the picture would of course change. It would probably also be similar if we included a single San individual from Africa.
So asymmetrical donation-receiving for a population can be explained by distinct haplotypes for that population vs other populations.
(Thanks to the authors of Finestructure for their explanations and patience!)
tirsdag 28. august 2012

søndag 26. august 2012
Saami dimension in the PCA
Saami and Finns have always been close to each other in the higher dimensions of the PCA plots and heatmaps from the previous analysis, however in dimension D1-D6 the Saamis clearly diverge away from the others in the panel into their own dimension. Finns here appears here to go in a complete opposite direction sharing space with Vologda Russians.


We see very clearly in this dimension the individuals of main Saami ancestry cluster into their own dimension while Finnish and Scandinavian individuals with Saami minority ancestry pull straight towards the individuals of mainly Saami ancestry.
This likely means that Saami do have distinctive haplotype segments that seperate them clearly from the other populations including Finns.
onsdag 15. august 2012
Scandinavians - Western Europeans with minor Saami-Finnish admixture
Changes from the last analysis: Added Bulgarians. Used complete reference popualtions. New participant FI23. FI4 have opted out. Else same specifications as in earlier runs. Adding more individuals increase the accuracy of the software but the increased diversity may smooth out smaller differences.
As we can see here from the previous run is that the main PCA dimensions have switched from the last run and we see the main structure we have often seen in the standard unlinked SNP MDS plots run through Plink software.
PCA plots shows independent genetic variations. The first dimensions shows the largest variations while the second dimensions shows the second largest variation and so on. A indvidual with equal background from two different populations would typically appear in line in the middle between these populations, so would also be the case for recently mixed populations. If foundereffect and genetic drift have occured in a population the population would typically not be in line between populations, however on PCA plots its also quite possible that the limited number of panel populations can give a similar effect on the PCA plot. In this PCA plot we are looking at the number of chunks (genetic segments including identical and related segments that have mutated).
As commentet in earlier post it appears like in the PCA plot D1-D2 (D1 horizontal, D2 vertical) that Scandinavians pull away from the other European populations because of Finnish-Saami like admixture early in its founding as they as a group all have it in various minor degree. It explain its in-line location between British and French and the Finns-Saami. It can be confirmed in the ChunkCount heatmaps (see results section) where Scandinavians shows strongest connections to these populations, but do not show same influence to other continental European populations. In experiments mixing events give lower number of chunkcounts to parents populations than the parents have to their own populations and within the new mixed population. We see this in Scandinavians, West-Finns and mixed groups like the two Bothnian groups. More recent mixed individuals vs Finns and Saamis is to be found further upstream towards the Finn and Saami.

We also see this in the PCA plot D1-D3 (D1 horizontal, D3 vertcal). However the combination with the D3 dimension make to difference the influences on the Scandinavians. We see that the upper half of the Scandinavian cluster is totally dominated by Swedes. It appears like Swedes may have got more influence from Finns while the Norwegians on the other hand appears be more influenced by the Saamis. The pull upwards may be because of a weaker relationship to Lithuanians according to the heatmap.
We further see that Finns in D3 appear to have an more intermediate position between the Saamis and the Vologda Russian, Mordovians and Estonians. In the heatmaps however we only see increased influence towards the Vologda Russians and Estonians, not the Mordovians. This indicate that the pull upward in D3 is due to increased relationship to the Vologda Russians and Estonians. Note that the two Finns FI23 and FI5 have confirmed Saami minority admixture so the relationship appears to be real.
In the heatmaps for the Saami we also see a increased relationship to the Vologda Russians however this influene may be a from a common source not directly from the Vologda Russians but from a third common Chuvash like source. This seems also indicated by the PCA plots as the Saami appears to pull more towards the Chuvash not the Vologda Russians..

As we can see here from the previous run is that the main PCA dimensions have switched from the last run and we see the main structure we have often seen in the standard unlinked SNP MDS plots run through Plink software.
PCA plots shows independent genetic variations. The first dimensions shows the largest variations while the second dimensions shows the second largest variation and so on. A indvidual with equal background from two different populations would typically appear in line in the middle between these populations, so would also be the case for recently mixed populations. If foundereffect and genetic drift have occured in a population the population would typically not be in line between populations, however on PCA plots its also quite possible that the limited number of panel populations can give a similar effect on the PCA plot. In this PCA plot we are looking at the number of chunks (genetic segments including identical and related segments that have mutated).
As commentet in earlier post it appears like in the PCA plot D1-D2 (D1 horizontal, D2 vertical) that Scandinavians pull away from the other European populations because of Finnish-Saami like admixture early in its founding as they as a group all have it in various minor degree. It explain its in-line location between British and French and the Finns-Saami. It can be confirmed in the ChunkCount heatmaps (see results section) where Scandinavians shows strongest connections to these populations, but do not show same influence to other continental European populations. In experiments mixing events give lower number of chunkcounts to parents populations than the parents have to their own populations and within the new mixed population. We see this in Scandinavians, West-Finns and mixed groups like the two Bothnian groups. More recent mixed individuals vs Finns and Saamis is to be found further upstream towards the Finn and Saami.

(PCA plot D1-D2 with population assignment)
We also see this in the PCA plot D1-D3 (D1 horizontal, D3 vertcal). However the combination with the D3 dimension make to difference the influences on the Scandinavians. We see that the upper half of the Scandinavian cluster is totally dominated by Swedes. It appears like Swedes may have got more influence from Finns while the Norwegians on the other hand appears be more influenced by the Saamis. The pull upwards may be because of a weaker relationship to Lithuanians according to the heatmap.
We further see that Finns in D3 appear to have an more intermediate position between the Saamis and the Vologda Russian, Mordovians and Estonians. In the heatmaps however we only see increased influence towards the Vologda Russians and Estonians, not the Mordovians. This indicate that the pull upward in D3 is due to increased relationship to the Vologda Russians and Estonians. Note that the two Finns FI23 and FI5 have confirmed Saami minority admixture so the relationship appears to be real.
In the heatmaps for the Saami we also see a increased relationship to the Vologda Russians however this influene may be a from a common source not directly from the Vologda Russians but from a third common Chuvash like source. This seems also indicated by the PCA plots as the Saami appears to pull more towards the Chuvash not the Vologda Russians..

(PCA plot D1-D3 with population assignment)
fredag 3. august 2012
New Finestructure Analysis
Its time for a new Finestructure analysis. The difference from the earlier Finestructure analysis are more project participants and more reference populations.
CHUNKCOUNTS:
Lets first look at the chunkcounts matrix, that is the number of shared segments including both identical and related segments that have mutated (closest neighbouring segment). In the matrix the rows are receiptants and columns are the donors.
Two main branches Saami-Finns and Continental-European-Scandinavian
We see the formation of two main branches: 1) Common Continental European and Scandinavian branch 2) Saami-Finnish branch. The former branch divide again into two subbranches a Western European branch and a Eastern European branch. The Scandinavians appears to divide at the earliest branch from the Western European branch. Early branching indicate more distant relateness, late branching indicates closer relatedness. In the eastern European branch the Chuvash break away the earliest from the rest and it make sense as they are a distant population. In the latter Saami-Finnish branch the Bothnian group appears to divide the earliest from the Saami and Finns and it make sense as they likely have more Scandinavian like influence. The arrangment of trees vs other trees is arbitrary so you need to look at the heatmap and branch level to make any judgment about relationship.


Bothnians - two groups with different influences
In the heatmap above we see the Bothnian2 group who shows strong relationship to Scandinavains have higher sharing with the Saami. Finns do not show a similar affiliation to this group. The group share especially with the Saami2 group that have that is known to have at least partly South-Saami ancestry. Several individuals in this group also have documented Saami ancestry from the South-Saami areas. This suggest that the reason for the Bothnian2 groups seperation from other Scandinavians is due to South-Saami influence. We also see this in the PCA plot below where the Bothnian2 group close to the Scandinavians appears to pull straight towards the Saami and not to Finns.
The Bothnian1 group appears to have a somewhat different history than the Bothnian2 group, while the latter appears to be Scandinavains with Saami admixture the former appears to be more like Finns with Scandinavian admixture. We see this both in the heatmaps and in the PCA plots where there is a pull toward the Scandinavians. There also appears like this group in general appears closer to Continental-European populations than the Finns.

Finns - two groups with more western and more eastern influences.
Internally Finns divide into two groups East-Finns Finn1 and West-Finns Finn2. Eastern Finns appears to have an increased sharing between each others compared to West-Finns this probably to a late expansion into eastern and northern Finland. Finns appears to affiliate to in decreasing order Bothnian1, Bothnian2, Estonians, Scandinavians and Vologda Russians. These are all geographically close or even overlapping groups. In the finer grades we observe that Eastern Finns appears to affiliate less with Scandinavians then Western Finns. East-Finns also appears affiliate less with more western continental populations than western Finns. Western Finns seem also to be a little closer to Lithuanians than western Finns but the difference is small.
We see from the PCA plot below that Eastern Finns and Saami dominate the far right of the first dimension (horizontal) but all Finns are above the horizontal line in the second dimension (vertical). This may indicate a common genetic backgound for Saami and East-Finn in that dimension. We do not know the "original" position for East-Finns but if they originally where closer to the Saamis position on the vertical their higher position on the vertical may be due to Baltic influences, however we also see that East-Finns have the same vertical height as the Vologda Russians so it is possible that there is a direct connection between Vologda Russians and East-Finns f.ex that the Vologda Russians originally had a larger Finnsih like component that later become more similar to slavs due to centuries of migration and assimilation moving Vologda Russians to its current position.
We see further that Western Finns appears right in line between Eastern Finns and Scandinavians. This indicate that Western Finns have more Scandinavians influence also seen in the heatmap and it is the reason why Western Finns appears closer to Scandinavians. This admixture may be one factor why West-Finns appears more diverse.
We also see in the PCA plot that Estonians, Mordovians and especially the Vologda Russians appears to pull away from the Lithuanians, Belorussians and Ukrainians towards the Finns. This indicate that even these populations are continental they have a significat Finnish like components.

Saami - various degree of Scandinavian and Chuvash like influence?
The Saami divide into two groups. The Saami1 group consists of Saami entirely of North-Saami origins while the Saami2 group also contain at least partly individuals of South-Saami origin. The heat map suggest a slightly closer connection to East-Finns than to West-Finns. The Saami2 groups shows increased relationship to the Bothnian2 group than the Saami1 group. The Saami1 group shows increased affinity to the Vologda Russians and Chuvash. Both groups show same affinity to the Estonians. The Saami2 group also shows increased affinity to the Scandinavians. To sum it Saami appears to seems to affiliate with more eastern population and strongest to its closest neighbours except for the Vologda Russians and Chuvash.
 The closer position of Saami2 in the PCA plot on the direct line to the Scandinavian may suggest Scandinavian influence however we do not know why East-Finns and the North-Saami group cluster to the far right. It may be the result of foundereffect and/or drift as no ancestral population can be inferred from this axis alone except it is shared by East-Finns.
On the vertical axis on the other hand we see that the Saami is at the same level as Italian, French, British and lower part of the Scandinavian cluster. It may indicate that Saami have ancestral relationship to these populations, however the positioning of the Chuvash and the increased chunk sharing indicate that the Saami maybe have been influenced vertically by a population with elements similar to the Chuvash or Vologda Russians. It may be a reflection of common Siberian like ancestry deteced in earlier analysis or an artificat of the PCA software as the Chuvash appears quite distant to the Saami in other dimensions. Further in earlier analysis there appear to be a strong correlation between Koryak, Chuvash and Vologda Russians in the Fennoscandia dataset.
Scandinavians - western, eastern and northern influences
The Scandinavians all fall into one group. Its part of the western/central european branch where it divide from the other subgroups at the earliest branch. In the heatmaps we see they are closest to the Botnian2 group that divide into a subgroup because of minority Saami ancestry. Next they affiliate to a subgroup of Brits. Then they also cluster to the Bothnian1 group that appears to be a group close to the Western Finn group pulling towards the Scandinavian cluster. Of the more distant populations the Scandinavians then cluster to the French. Then also to Finns especially the Western Finns. Scandinavians also shows increased affinity to Mordovians, Belorussians, Lithuanians and Ukrainians, actually more than Finns and Saami in general. However they have lower affinity to the Vologda Russians and Chuvash than Finns and Saami.
In the PCA plot we see that Scandinavians pull slightly away from the continental clusters towards partly the Finns and partly the Saami where they are much in line with the Belorussian-Ukrainian and the Lithuanian cluster. One may here suggest that the reason for this positioning is that Lithuanians and the Belorussian-Ukrainians do have a common backgroun in dimension but a check of the heatmap suggest that the highest intensity is between the British-French and the Finns-Saami with the former having the highest intensity. So the pull of Scandinavians from the French and the British seems to be the result of Finns and Saami influence, on the other hand one cant exclude that French and British have been pulled away from the Scandinavisn either by influenes not seen in this population panel.
On the vertical we see that the Scandinavians appears to be slighty moved upwards compared to the French and the British. This is possibly due to the pull from the Lithuanians and Belorussian-Ukrainians as Scandinavians appears to show a stronger pull to these populations in the heatmaps than to Romanians and Hungarians. If we look at the individual PCA plot we can also see that Swedes appears to dominate the upper right part while Norwegians appears to dominate the lower left part. This reflect that Swedes appears to have more eastern influences both in the direction of Lithuanians and Belorussians-Ukrainians and in the direction of Finns. The Norwegian on the other hand tend to move towards the western populations like French and the British suggesting they have more western like influences.

OTHER PLOTS AND HEATMAPS:


(Updated 13 Aug 2012)
CHUNKCOUNTS:
Lets first look at the chunkcounts matrix, that is the number of shared segments including both identical and related segments that have mutated (closest neighbouring segment). In the matrix the rows are receiptants and columns are the donors.
Two main branches Saami-Finns and Continental-European-Scandinavian
We see the formation of two main branches: 1) Common Continental European and Scandinavian branch 2) Saami-Finnish branch. The former branch divide again into two subbranches a Western European branch and a Eastern European branch. The Scandinavians appears to divide at the earliest branch from the Western European branch. Early branching indicate more distant relateness, late branching indicates closer relatedness. In the eastern European branch the Chuvash break away the earliest from the rest and it make sense as they are a distant population. In the latter Saami-Finnish branch the Bothnian group appears to divide the earliest from the Saami and Finns and it make sense as they likely have more Scandinavian like influence. The arrangment of trees vs other trees is arbitrary so you need to look at the heatmap and branch level to make any judgment about relationship.

(ChunkCount aggregated for individuals)

(ChunkCount aggregated with population labels)
Bothnians - two groups with different influences
In the heatmap above we see the Bothnian2 group who shows strong relationship to Scandinavains have higher sharing with the Saami. Finns do not show a similar affiliation to this group. The group share especially with the Saami2 group that have that is known to have at least partly South-Saami ancestry. Several individuals in this group also have documented Saami ancestry from the South-Saami areas. This suggest that the reason for the Bothnian2 groups seperation from other Scandinavians is due to South-Saami influence. We also see this in the PCA plot below where the Bothnian2 group close to the Scandinavians appears to pull straight towards the Saami and not to Finns.
The Bothnian1 group appears to have a somewhat different history than the Bothnian2 group, while the latter appears to be Scandinavains with Saami admixture the former appears to be more like Finns with Scandinavian admixture. We see this both in the heatmaps and in the PCA plots where there is a pull toward the Scandinavians. There also appears like this group in general appears closer to Continental-European populations than the Finns.

Finns - two groups with more western and more eastern influences.
Internally Finns divide into two groups East-Finns Finn1 and West-Finns Finn2. Eastern Finns appears to have an increased sharing between each others compared to West-Finns this probably to a late expansion into eastern and northern Finland. Finns appears to affiliate to in decreasing order Bothnian1, Bothnian2, Estonians, Scandinavians and Vologda Russians. These are all geographically close or even overlapping groups. In the finer grades we observe that Eastern Finns appears to affiliate less with Scandinavians then Western Finns. East-Finns also appears affiliate less with more western continental populations than western Finns. Western Finns seem also to be a little closer to Lithuanians than western Finns but the difference is small.
We see from the PCA plot below that Eastern Finns and Saami dominate the far right of the first dimension (horizontal) but all Finns are above the horizontal line in the second dimension (vertical). This may indicate a common genetic backgound for Saami and East-Finn in that dimension. We do not know the "original" position for East-Finns but if they originally where closer to the Saamis position on the vertical their higher position on the vertical may be due to Baltic influences, however we also see that East-Finns have the same vertical height as the Vologda Russians so it is possible that there is a direct connection between Vologda Russians and East-Finns f.ex that the Vologda Russians originally had a larger Finnsih like component that later become more similar to slavs due to centuries of migration and assimilation moving Vologda Russians to its current position.
We see further that Western Finns appears right in line between Eastern Finns and Scandinavians. This indicate that Western Finns have more Scandinavians influence also seen in the heatmap and it is the reason why Western Finns appears closer to Scandinavians. This admixture may be one factor why West-Finns appears more diverse.
We also see in the PCA plot that Estonians, Mordovians and especially the Vologda Russians appears to pull away from the Lithuanians, Belorussians and Ukrainians towards the Finns. This indicate that even these populations are continental they have a significat Finnish like components.

(ChunkCount aggregated PCA with population labels)
Saami - various degree of Scandinavian and Chuvash like influence?
The Saami divide into two groups. The Saami1 group consists of Saami entirely of North-Saami origins while the Saami2 group also contain at least partly individuals of South-Saami origin. The heat map suggest a slightly closer connection to East-Finns than to West-Finns. The Saami2 groups shows increased relationship to the Bothnian2 group than the Saami1 group. The Saami1 group shows increased affinity to the Vologda Russians and Chuvash. Both groups show same affinity to the Estonians. The Saami2 group also shows increased affinity to the Scandinavians. To sum it Saami appears to seems to affiliate with more eastern population and strongest to its closest neighbours except for the Vologda Russians and Chuvash.

On the vertical axis on the other hand we see that the Saami is at the same level as Italian, French, British and lower part of the Scandinavian cluster. It may indicate that Saami have ancestral relationship to these populations, however the positioning of the Chuvash and the increased chunk sharing indicate that the Saami maybe have been influenced vertically by a population with elements similar to the Chuvash or Vologda Russians. It may be a reflection of common Siberian like ancestry deteced in earlier analysis or an artificat of the PCA software as the Chuvash appears quite distant to the Saami in other dimensions. Further in earlier analysis there appear to be a strong correlation between Koryak, Chuvash and Vologda Russians in the Fennoscandia dataset.
Scandinavians - western, eastern and northern influences
The Scandinavians all fall into one group. Its part of the western/central european branch where it divide from the other subgroups at the earliest branch. In the heatmaps we see they are closest to the Botnian2 group that divide into a subgroup because of minority Saami ancestry. Next they affiliate to a subgroup of Brits. Then they also cluster to the Bothnian1 group that appears to be a group close to the Western Finn group pulling towards the Scandinavian cluster. Of the more distant populations the Scandinavians then cluster to the French. Then also to Finns especially the Western Finns. Scandinavians also shows increased affinity to Mordovians, Belorussians, Lithuanians and Ukrainians, actually more than Finns and Saami in general. However they have lower affinity to the Vologda Russians and Chuvash than Finns and Saami.
In the PCA plot we see that Scandinavians pull slightly away from the continental clusters towards partly the Finns and partly the Saami where they are much in line with the Belorussian-Ukrainian and the Lithuanian cluster. One may here suggest that the reason for this positioning is that Lithuanians and the Belorussian-Ukrainians do have a common backgroun in dimension but a check of the heatmap suggest that the highest intensity is between the British-French and the Finns-Saami with the former having the highest intensity. So the pull of Scandinavians from the French and the British seems to be the result of Finns and Saami influence, on the other hand one cant exclude that French and British have been pulled away from the Scandinavisn either by influenes not seen in this population panel.
On the vertical we see that the Scandinavians appears to be slighty moved upwards compared to the French and the British. This is possibly due to the pull from the Lithuanians and Belorussian-Ukrainians as Scandinavians appears to show a stronger pull to these populations in the heatmaps than to Romanians and Hungarians. If we look at the individual PCA plot we can also see that Swedes appears to dominate the upper right part while Norwegians appears to dominate the lower left part. This reflect that Swedes appears to have more eastern influences both in the direction of Lithuanians and Belorussians-Ukrainians and in the direction of Finns. The Norwegian on the other hand tend to move towards the western populations like French and the British suggesting they have more western like influences.

OTHER PLOTS AND HEATMAPS:

(ChunkCount aggregated PCA D1-D2 with individual labels)
 (ChunkCount aggregated PCA D1-D3 with individual labels)


(ChunkLenght aggregated with population labels)

(ChunkLenght aggregated for individuals)


(ChunkLenght aggregated PCA D1-D2 with population labels)
(Unable to seperate the coloring for one Saami group)
(Unable to seperate the coloring for one Saami group)

(SegmentSize CL/CC aggregated for individals)

(SegmentSize CL/CC aggregated with population labels)

(SegmentSize CL/CC aggregated PCA with population labels)

(SegmentSize CL/CC aggregated PCA with individual labels)
(Updated 13 Aug 2012)
onsdag 1. august 2012
MDS Update 85 individuals
Its time for a new MDS update.
We see much the same structure in the two first dimensions D1-D2 as in earlier analysis. The X or horizontal axis D1 shows south-west Europe at the far left. The variance then as we go further right into two branches on the Y-asis or D2 where the upper branch contains continental European populations while the Scandinavians, Finns and the Saamis form the lower branch. At the edge of the continental branch we find the Chuvashes while on the edge of the lower branch we find the Saamis and Finns.

The second plot shows D1-D3. Here we see on the vertical D3 Lithuanians on the top and the Italians and the Chuvash at the bottom. Finns and Scandinavians appears to cluster abit over the middle while the Saamis appears to cluster abit lower than the middle at the same levels as French, Romanians and Italians.

Third plot D2-D3 is a combination of D2 and D3 explained above.

We see much the same structure in the two first dimensions D1-D2 as in earlier analysis. The X or horizontal axis D1 shows south-west Europe at the far left. The variance then as we go further right into two branches on the Y-asis or D2 where the upper branch contains continental European populations while the Scandinavians, Finns and the Saamis form the lower branch. At the edge of the continental branch we find the Chuvashes while on the edge of the lower branch we find the Saamis and Finns.

The second plot shows D1-D3. Here we see on the vertical D3 Lithuanians on the top and the Italians and the Chuvash at the bottom. Finns and Scandinavians appears to cluster abit over the middle while the Saamis appears to cluster abit lower than the middle at the same levels as French, Romanians and Italians.

Third plot D2-D3 is a combination of D2 and D3 explained above.

tirsdag 3. juli 2012
New Chromopainter Analysis
New Chromopainter analysis is ready. Structure much the same as earlier analysis but I have this time added more populations and population controls.
ANALYSIS RESULT
OVERVIEW:
ChunkCounts:
ChunkCounts or number of segments shows the Saami and Finns appears similar to many donor populations and together shows the strongest affiliation to the Vologda Russians, but on average the Saami shows stronger affinity to the Koryaks, to the Chuvash and to the Vologda Russians. The Finns on the other hands shows stronger affinity to the Lithuanians.
The Scandinavians shows a very similar profile to the donor populations seeming closest to the British, French and Lithuanains and in general appears closer to the Meditterian populations.
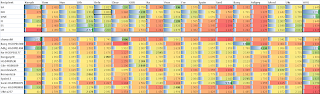
The Lithuanians and Estonians seems closest to the eastern populations like Lithuanians, Belorussians, Ukrainians, Vologda Russians and Mordovians. In general more distant to the Medditerian populations.
We see that most controls have been assigned to the right populations. The exception is the Hungarian that got assign to the Belorussian population, the French who got assigned tot he British population, the Romanian who got assigned to the Lithuanian population, the Spanish who got assigned to the Basque population and the Ukranian LV who got assigned to the Lithuanian population. Some of these affiliation appears rather weak suggesting mixed backgroun or origins more distant from the donor populations.
ChunkLenght:
The picture for total shared is much the same as the analysis above.

Mutations:
The picture is much the same as the analysis above.

Mutation Density:
Mutation density calculation have changed. Instead of earlier as number of mutations divided by proportions now instead number of mutations is divided by total shared (ChunkLenght). The numbers are presented as percentages but is really ratios.

The numbers show much the same that have been seen before. The Saami appear as before to have largest mution density to most of the donor populations, then the Norwegians, then the Swedes, then the Finns and finally Estonians and Lithuanians.
In the controls we can see that several control individuals like f.ex the British shows a similar mutation density as the Lithanians and Estonians, while f.ex the Spanish appears to have very high mutation density compared to most of the panel. The reason for these may be many: 1) the Spanish are an older and larger population and therefore have accumulated more mutations over time 2) there is "foreign" haplotypes among the Spanish or in this control that increase mutation density.
One should here expect to see the lowest mutation density to your own population but only a few of the control individuals have correct assignment, however for several individuals it appears to be a regional lower mutation density to neighbouring populations and sometimes also more distant ones.
The problem is probably cased by difference in number of unique mutations between the populations making direct comparisment difficult. However in general it appears like especially Lithuanians appears more "matchy" to other populations when it comes to mutation diversity meaning their haplotypes matching other populations appears to have less mutation difference. Some other reason may also be that 289k may not bee enough to give proper numbers of mutation counts to give a clear picture. In previous analysis the PCA of the mutation counts was much more fuzzy than those made from ChunkCounts and ChunkLenght.
INDIVIDUAL RESULTS:
ChunkCounts:

ChunkLenght:

Mutations:

Mutation Density:

ANALYSIS RESULT
OVERVIEW:
ChunkCounts:
ChunkCounts or number of segments shows the Saami and Finns appears similar to many donor populations and together shows the strongest affiliation to the Vologda Russians, but on average the Saami shows stronger affinity to the Koryaks, to the Chuvash and to the Vologda Russians. The Finns on the other hands shows stronger affinity to the Lithuanians.
The Scandinavians shows a very similar profile to the donor populations seeming closest to the British, French and Lithuanains and in general appears closer to the Meditterian populations.

The Lithuanians and Estonians seems closest to the eastern populations like Lithuanians, Belorussians, Ukrainians, Vologda Russians and Mordovians. In general more distant to the Medditerian populations.
We see that most controls have been assigned to the right populations. The exception is the Hungarian that got assign to the Belorussian population, the French who got assigned tot he British population, the Romanian who got assigned to the Lithuanian population, the Spanish who got assigned to the Basque population and the Ukranian LV who got assigned to the Lithuanian population. Some of these affiliation appears rather weak suggesting mixed backgroun or origins more distant from the donor populations.
ChunkLenght:
The picture for total shared is much the same as the analysis above.

Mutations:
The picture is much the same as the analysis above.

Mutation Density:
Mutation density calculation have changed. Instead of earlier as number of mutations divided by proportions now instead number of mutations is divided by total shared (ChunkLenght). The numbers are presented as percentages but is really ratios.

The numbers show much the same that have been seen before. The Saami appear as before to have largest mution density to most of the donor populations, then the Norwegians, then the Swedes, then the Finns and finally Estonians and Lithuanians.
In the controls we can see that several control individuals like f.ex the British shows a similar mutation density as the Lithanians and Estonians, while f.ex the Spanish appears to have very high mutation density compared to most of the panel. The reason for these may be many: 1) the Spanish are an older and larger population and therefore have accumulated more mutations over time 2) there is "foreign" haplotypes among the Spanish or in this control that increase mutation density.
One should here expect to see the lowest mutation density to your own population but only a few of the control individuals have correct assignment, however for several individuals it appears to be a regional lower mutation density to neighbouring populations and sometimes also more distant ones.
The problem is probably cased by difference in number of unique mutations between the populations making direct comparisment difficult. However in general it appears like especially Lithuanians appears more "matchy" to other populations when it comes to mutation diversity meaning their haplotypes matching other populations appears to have less mutation difference. Some other reason may also be that 289k may not bee enough to give proper numbers of mutation counts to give a clear picture. In previous analysis the PCA of the mutation counts was much more fuzzy than those made from ChunkCounts and ChunkLenght.
INDIVIDUAL RESULTS:
ChunkCounts:

ChunkLenght:

Mutations:

Mutation Density:

fredag 29. juni 2012
Ancient Gotlanders in Finestructure
EDIT 30/08-2013: I now consider this analysis outdated. Please check the more recent posts with reanalysis of Ajv52, Ajv70, Ire8, Gok4 and Ste7.
We continue the analysis of the ancient Gotlanders vs our project participants.
In the last analysis using ADMIXTURE we assumed that all SNP's where independent from each other. However in reality we are working with segments of linked SNP's or haplotypes. Chromopainter can analyse haplotype and Finestructure can build a tree based on these.
Input: 22k SNP's. MCMC: 100 000, 100 000, Tree: 10 000, 100 000. HapMap recombination map. c-factor: 0.0262 (effective number of independent genetic element).
THE RESULTS:
FIRST ANALYSIS:
ChunkCounts:
The number of shared segments tree appears to set the ancient Gotlanders at its own branch already at the root of the tree. The closest neighbour is the common Finnish and Saami branch. The branching seem to indicate that Finns and Saamis are closer to the ancient Gotlanders than other populations.
The Finnish cluster is closer maybe indicate a closer relationship than the Saami. It would then be in accordance with the earlier ADMIXTURE analysis:
Note that the the various degree of sharing to the ancient Gotlanders at the rightmost vertical partly yellow strip. Yellow indicate more distant relationship gradiant towards blue is closer relationship (see vertical bar to the right of the matrix).
The ancient Gotlanders appears to have various degree of sharing to other individuals. The reason why the tree is so fragmentet is because of the very low c-factor. It indicate that the elemets are very fragmentet because of few markers (22k). A c-factor of 0 is basically independent SNP's while a c-factor of 1 is basically linked SNP's. In our last Finestructure analysis this factor using 289k was a round 0.48


ChunkLength.
The total lenght of shared segments indicate much the same structure as mentioned above but with some internal movement.

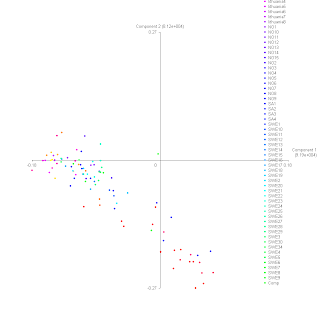
EXPERIMENTING:
I did however during my own experiments with Finestructure play around with the c-factor parameter. If I set it to 1 meaning considering the result as one independent genetic element the results changed.
ChunkCounts:


We see now that the Saamis and Finns changed place, the Saamis closest to the ancient Gotlanders while a subsection of the Saami and Saami related individuals moved to the top. We now also see the more familier typical Finestructure matrix clustering.
We can now also see from the coloring vs the ancient Gotlanders that its only the two Saami groups that have increased sharing with the ancient Gotlanders at the rightmost vertical that move into pink meaning the closest.
ChunkLenght:
The total segments shared give a similar story but all the Saamis are now into the same cluster. The coloring seem to indicate that Saamis have the closest relationship, then Scandinavians, then Lithuanians and then finally Finns. This is not in accordance with the earlier ADMIXTURE analysis.


DISCUSSION:
The first analysis appears to be in accordance with ADMIXTURE and is after the book prescribed by the authors of Finestructure. Finns are the closest to the ancient Gotlanders when assuming many genetic elements,
However if assuming only one genetic element the result is in accordance with Chromopainter raw output data for ChunkCounts and ChunkLenght that says that on population average Saamis are the closest to the ancient Gotlanders, then Scandinavians, then Lithuanians and finally Finns.
In my earlier analysis below using only Chromopainter without the help of Finestructure the population assigment for individuals have been correct for most individuals and this analysis appears to show correct and known relationships between the populations in question when assuming c-factor of 1. If assuming a c-factor of 0 the analysis would probably converge more with the ADMIXTURE analysis.
It seems therefor to me that the clustering of Finns close to the Saami maybe be due to more recent connections like migration of Finns to Saami. This because the connection to the ancient Gotlander appears more distant for Finns than for Saami.
The connection of the ancient Gotlander to the Scandinavians seems to be direct. It doesnt seem to have gone through the North-Saamis or Finns as they look like today to Scandinavians. However we know little about the genetics of the South-Saamis. The individuals of partly South-Saami ancestry that show up in the MDS-plots have not maanged to differentiate themself enough in this analysis from Scandinavians.
(Updated 01/07/2012)
We continue the analysis of the ancient Gotlanders vs our project participants.
In the last analysis using ADMIXTURE we assumed that all SNP's where independent from each other. However in reality we are working with segments of linked SNP's or haplotypes. Chromopainter can analyse haplotype and Finestructure can build a tree based on these.
Input: 22k SNP's. MCMC: 100 000, 100 000, Tree: 10 000, 100 000. HapMap recombination map. c-factor: 0.0262 (effective number of independent genetic element).
THE RESULTS:
FIRST ANALYSIS:
ChunkCounts:
The number of shared segments tree appears to set the ancient Gotlanders at its own branch already at the root of the tree. The closest neighbour is the common Finnish and Saami branch. The branching seem to indicate that Finns and Saamis are closer to the ancient Gotlanders than other populations.
The Finnish cluster is closer maybe indicate a closer relationship than the Saami. It would then be in accordance with the earlier ADMIXTURE analysis:
Note that the the various degree of sharing to the ancient Gotlanders at the rightmost vertical partly yellow strip. Yellow indicate more distant relationship gradiant towards blue is closer relationship (see vertical bar to the right of the matrix).
The ancient Gotlanders appears to have various degree of sharing to other individuals. The reason why the tree is so fragmentet is because of the very low c-factor. It indicate that the elemets are very fragmentet because of few markers (22k). A c-factor of 0 is basically independent SNP's while a c-factor of 1 is basically linked SNP's. In our last Finestructure analysis this factor using 289k was a round 0.48


The total lenght of shared segments indicate much the same structure as mentioned above but with some internal movement.


EXPERIMENTING:
I did however during my own experiments with Finestructure play around with the c-factor parameter. If I set it to 1 meaning considering the result as one independent genetic element the results changed.
ChunkCounts:


We can now also see from the coloring vs the ancient Gotlanders that its only the two Saami groups that have increased sharing with the ancient Gotlanders at the rightmost vertical that move into pink meaning the closest.
ChunkLenght:
The total segments shared give a similar story but all the Saamis are now into the same cluster. The coloring seem to indicate that Saamis have the closest relationship, then Scandinavians, then Lithuanians and then finally Finns. This is not in accordance with the earlier ADMIXTURE analysis.


The first analysis appears to be in accordance with ADMIXTURE and is after the book prescribed by the authors of Finestructure. Finns are the closest to the ancient Gotlanders when assuming many genetic elements,
However if assuming only one genetic element the result is in accordance with Chromopainter raw output data for ChunkCounts and ChunkLenght that says that on population average Saamis are the closest to the ancient Gotlanders, then Scandinavians, then Lithuanians and finally Finns.
In my earlier analysis below using only Chromopainter without the help of Finestructure the population assigment for individuals have been correct for most individuals and this analysis appears to show correct and known relationships between the populations in question when assuming c-factor of 1. If assuming a c-factor of 0 the analysis would probably converge more with the ADMIXTURE analysis.
It seems therefor to me that the clustering of Finns close to the Saami maybe be due to more recent connections like migration of Finns to Saami. This because the connection to the ancient Gotlander appears more distant for Finns than for Saami.
The connection of the ancient Gotlander to the Scandinavians seems to be direct. It doesnt seem to have gone through the North-Saamis or Finns as they look like today to Scandinavians. However we know little about the genetics of the South-Saamis. The individuals of partly South-Saami ancestry that show up in the MDS-plots have not maanged to differentiate themself enough in this analysis from Scandinavians.
(Updated 01/07/2012)
Abonner på:
Innlegg (Atom)